Main Screen
The Main Screen is your central hub for monitoring weather conditions, tracking pressure changes, and logging symptoms. Here's a comprehensive guide to each section.
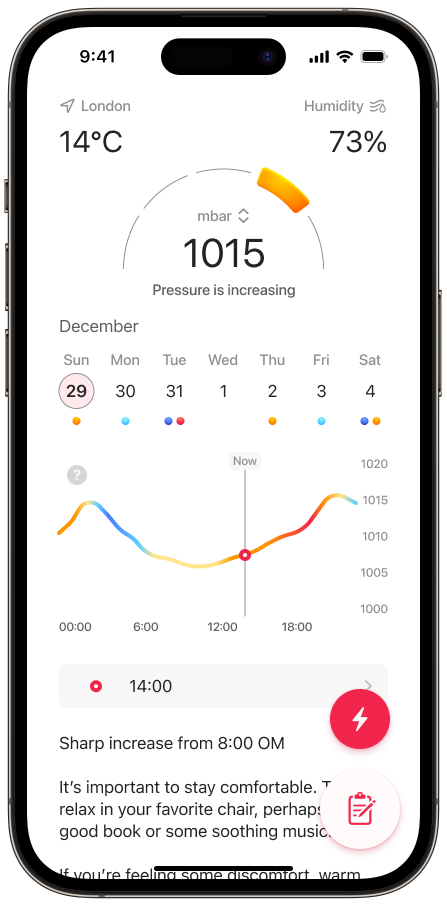
Current Weather
This section provides real-time weather information for your location, including:
- Your location
- Current temperature
- Humidity levels
Pressure Gauge Indicator
The prominent central gauge displays the current barometric pressure in your chosen unit.
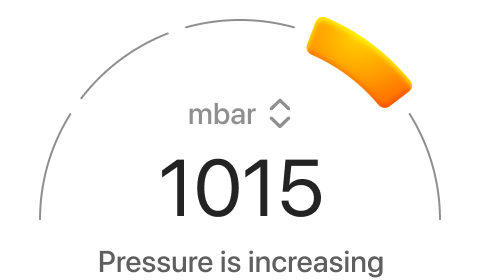
The gauge provides visual indicators to help you understand pressure trends. It shows the pressure in relation to the previous hour.
We compare the pressure reading from the current hour with the reading from the previous hour.
- Pressure is stable if the difference is less than 0.3 mbar.
- Pressure is increasing if it has increased by more than 0.3 mbar.
- Pressure in increasing rapidly if it has increased by more than 0.6 mbar.
- Pressure in decreasing if it has decreased by more than 0.3 mbar.
- Pressure in decreasing rapidly if it has decreased by more than 0.6 mbar.
Gauge has five positions and color coding that helps identify pressure stability.
Week View Navigation
The week view allows you to analyze pressure patterns over time. Swipe left to view previous week. Under each day you can see red/blue dots.
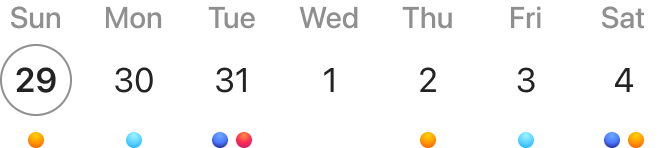
Currently selected day is indicated by a gray stroke circle. Under each day you can see colored dots. They help you understand pressure changes for the whole week at a glance:
- Red dot means that during the day there will be a rapid pressure increase.
- Blue dot means that during the day there will be a rapid pressure drop.
Pressure Forecast Chart
The interactive pressure chart displays detailed pressure variations throughout the day:
- Bottom axis shows hours (00:00 to 23:59)
- Right axis displays pressure values in your chosen unit
- Sharp pressure changes, which have the most impact on your well-being, are marked with colors:
- Blue means a sharp drop in pressure
- Red means a sharp rise in pressure
- Yellow means the pressure is stable
Attacks for the Day
This section lists all recorded attacks for the selected day:
- Shows time and severity of each attack
- Tap any entry to view detailed attack information
- Helps track patterns between pressure changes and symptoms
Daily Summary
A text-based summary of the day's pressure forecast and potential impact on well-being. The Daily Summary consists of three parts:
1. General Pressure Trend
The first line of the Daily Summary describes the overall pressure trend for the day. It will tell you if the pressure will remain stable, increase, decrease, or fluctuate (go up and down) throughout the day.
For example: "The pressure will increase throughout the day."
2. Rapid Pressure Changes
After the general trend, the most significant pressure changes will appear on separate lines. If consecutive hours show the same type of change, they will be grouped together.
For example: "Rapid increase from 3:00 PM to 4:00 PM" or "Rapid decrease at 6:00 PM"
3. Daily Recommendations
Personalized advice based on the pressure forecast and your symptom history to help you prepare for the day.
Attacks Tracking
Two main options for logging symptoms:
- Quick Log: Rapidly record basic attack information
- Daily Journal: Detailed symptom tracking with additional context
For more information about tracking options, see our Symptom Journaling Guide.
Menu Options
- Share Today's Forecast: Share a snapshot of today's forecast as an image with friends and family.
- All Recorded Data: Access your complete history of recorded attacks and symptoms.
- Export Report: Generate reports of your recorded attacks:
- Settings: Customize app preferences and configurations. See our Settings Guide for detailed information.
- Ask a Question: Have feedback or need help? Use our feedback form to reach out to our team.